
Visualize results
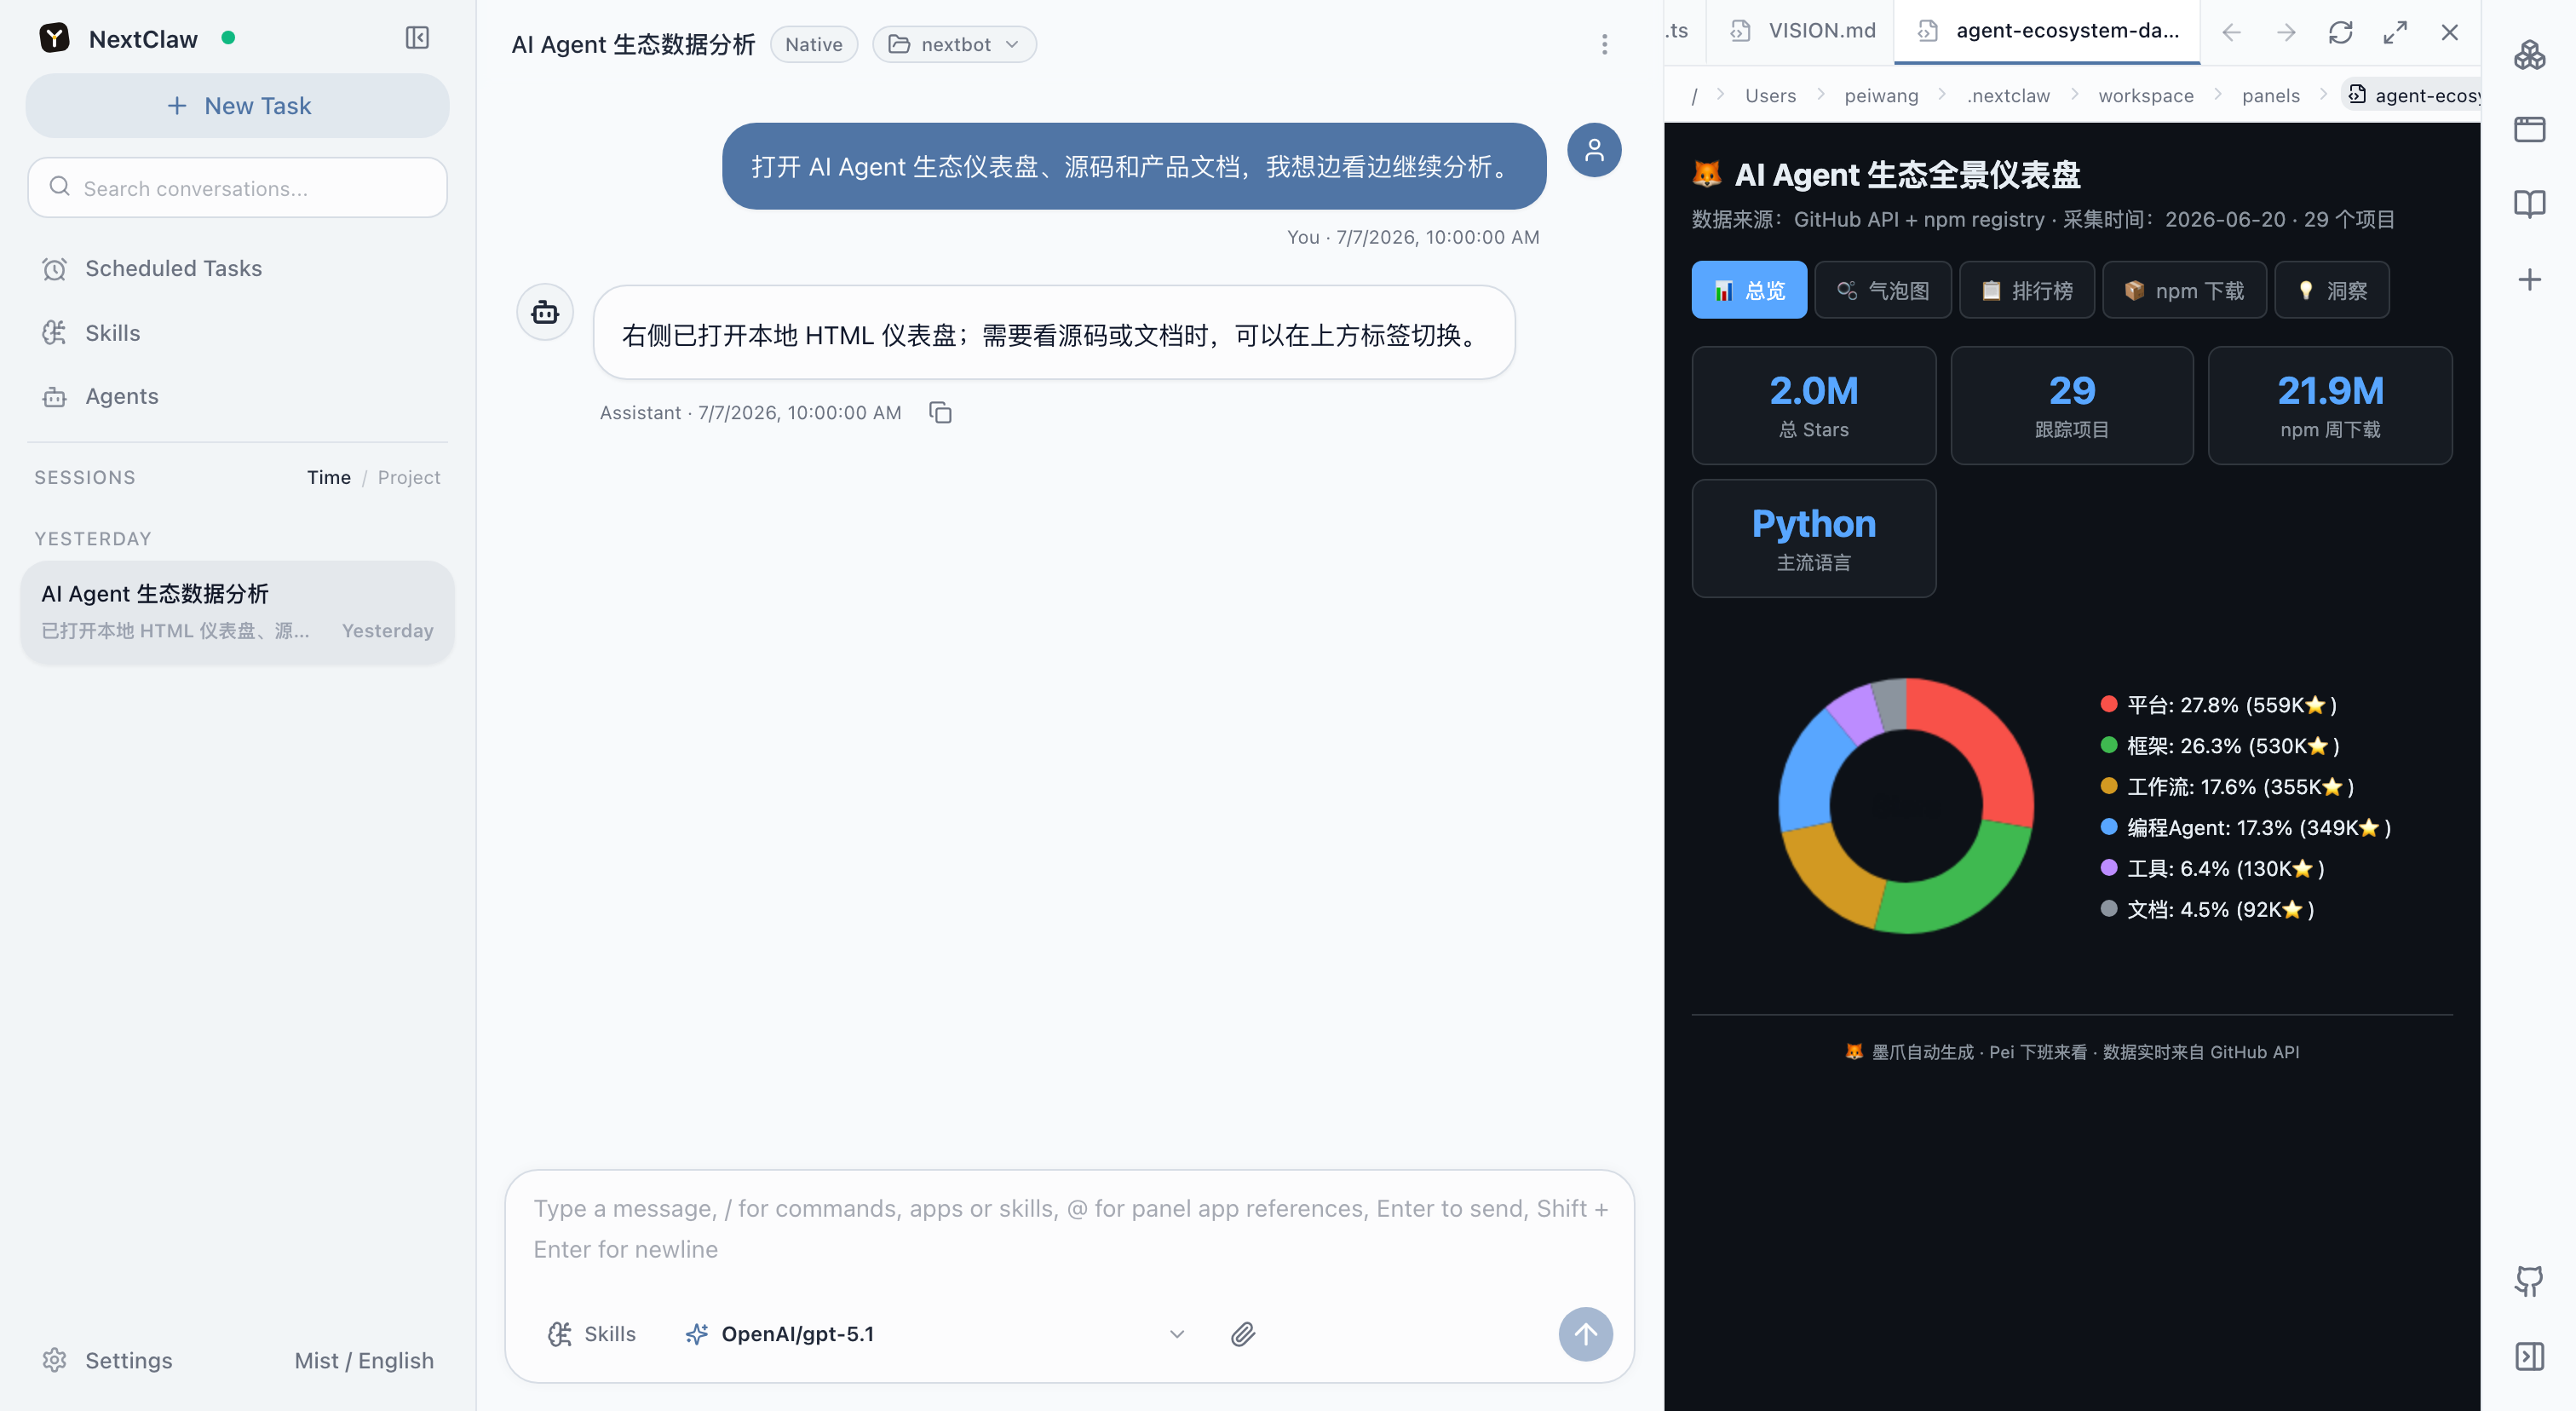
When comparison, relationships, change, or spatial structure are hard to understand in prose, NextClaw can present the result as a table, diagram, image, HTML report, or reusable Panel App. You can request a specific format, or describe what you need to understand and let the agent choose the smallest useful medium.
When a visual helps
| What you need to understand | Useful result | Common examples |
|---|---|---|
| The same fields across several items | Compact table | Plans, prices, versions, or configurations |
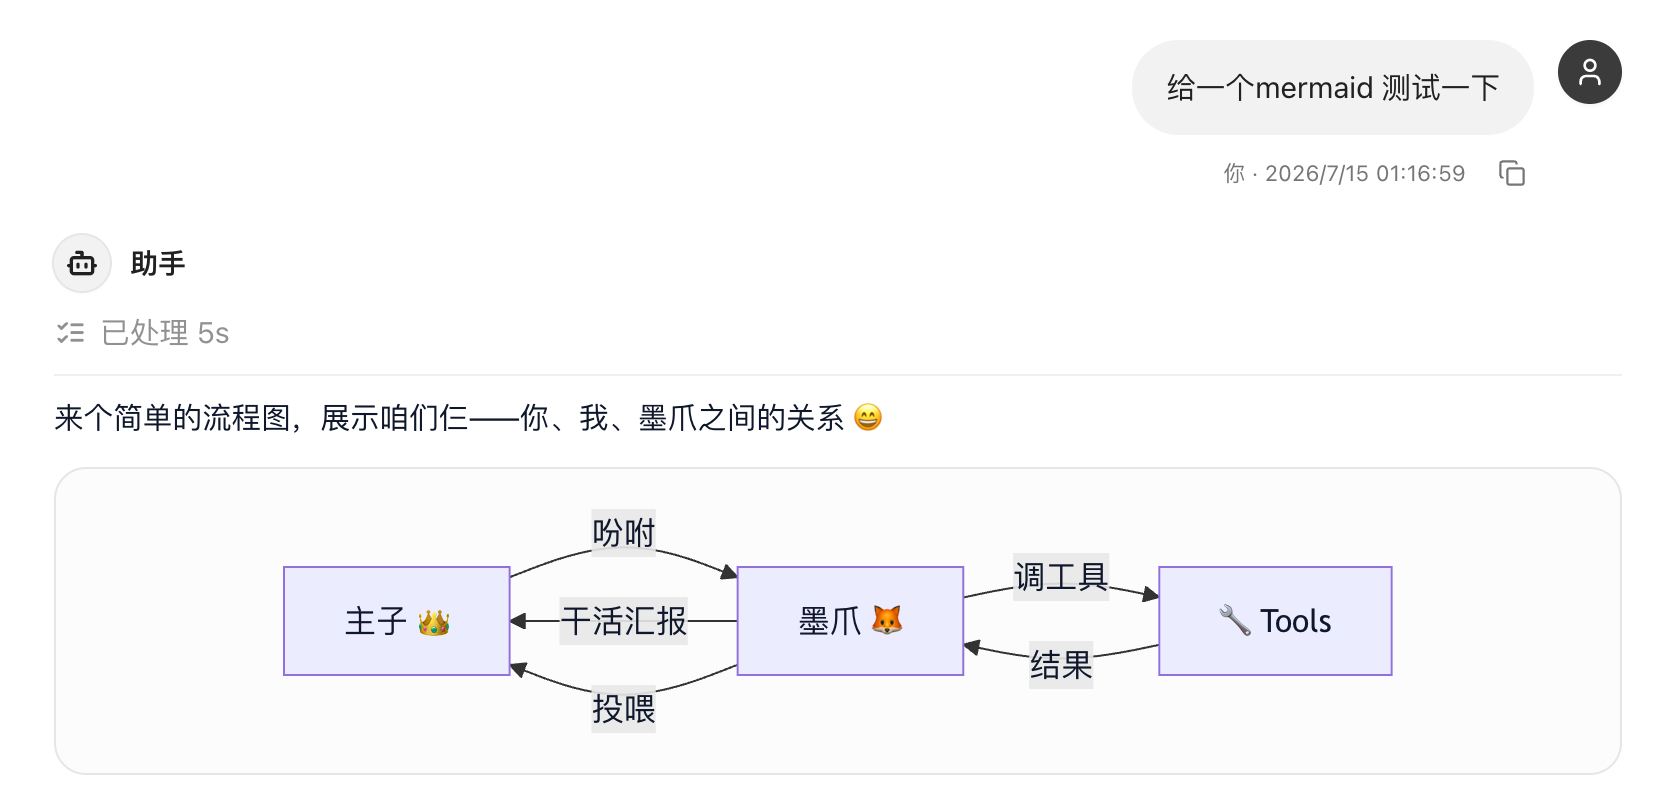
| Steps, hierarchy, or dependencies | Mermaid diagram | Workflows, architecture, timelines, or state changes |
| Trends, distributions, or composition | Focused chart or HTML report | Monthly change, ranges, or part-to-whole analysis |
| Appearance or spatial relationships | Image | Interface options, layouts, or visual concepts |
| Something you will adjust and use again | Panel App | Dashboards, calculators, forms, or control surfaces |
Plain text is usually better for a simple fact, a short explanation, or a single action. A visual should reduce the work required to understand the answer, not decorate every response.
Describe what you need to see
You do not need to know the name of a Skill first. Give NextClaw the outcome, source material, constraints, and expected deliverable. Specify a table, diagram, or other medium only when the format itself matters.
Compare three deployment options by cost, maintenance effort, and best-fit use case. Verify the available material first, then show the differences in one compact table. Add a focused dependency diagram only if it makes the relationship clearer. Do not invent scores.
Explain the relationship between user input, intent recognition, tool calls, result validation, and the final response. Use one Mermaid flowchart for the main path and fallback, followed by a short description of each stage.
Where the result appears
- In the current response: tables, Mermaid diagrams, images, and smaller interactive HTML results can appear directly in the task.
- In the session workspace: larger HTML reports, source files, and related artifacts can open on the right for inspection and refinement.
- As a Panel App: a tool that needs repeated inputs or ongoing use can stay in the side panel and reopen from the app list.
Refine instead of restarting
After a visual result exists, name what should stay and what should change:
Keep the current data. Change the chart to monthly intervals and label the original value beside each anomaly.Reduce this flowchart to five main nodes. Remove implementation details, but keep the failure fallback.We will use this result every week. Keep the current calculations and turn it into a Panel App with a date-range input.Review the result
- Source scope: are the source, time range, and filters correct?
- Metric definitions: are units, denominators, deduplication, and calculations explicit?
- Visual relationship: does the result actually clarify comparison, sequence, hierarchy, or dependency?
- Inference boundaries: are thresholds, scores, causal claims, and judgments supported?
- Final deliverable: do files open, numbers reconcile, and interactions work?
Related: Inspect task results · Analyze data and build charts · Generate an image · Panel Apps